By Maia Salti
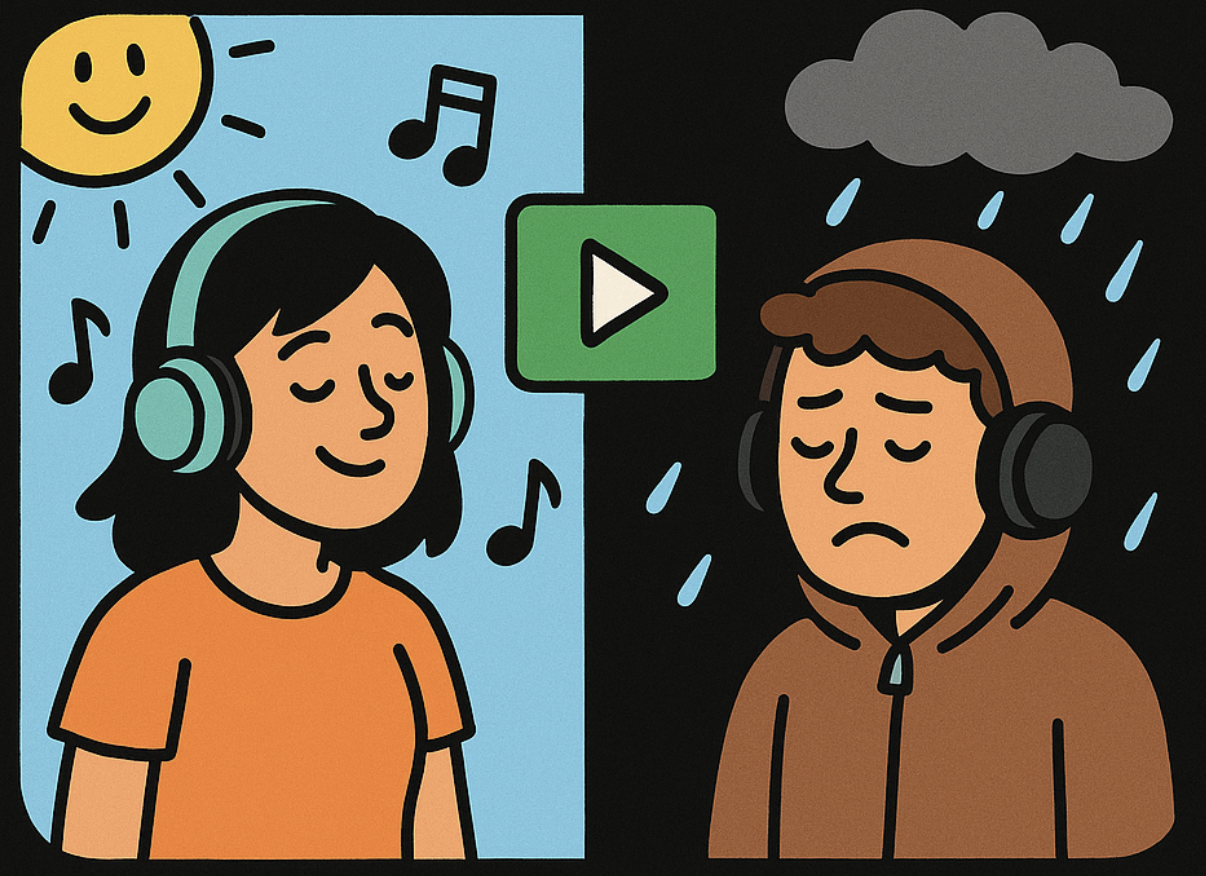
 Seasonal contrast in music listening habits: sunny weather versus rainy day moods. (Image generated by ChatGPT)
TL;DR
• Tropical countries prefer sadder music: Average valence of 49.4% vs seasonal countries' 51.4%
• Universal seasonal peaks and lows: Both regions peak in April (54.0% tropical, 57.4% seasonal) and hit lows in September (44.4% tropical, 46.8% seasonal)
• Seasonal swings are universal: Both regions show very similar mood patterns throughout the year (6.8 vs 5.1 percentage point swings)
I've spent parts of my life in both seasonal and non-seasonal countries, Singapore and the United Kingdom, and it's made me notice just how much the weather can mess with your mood. I still remember walking out of school in London at 4pm only to find the sky already dark. As a kid, that felt pretty miserable.
Music has always been my way of leaning into whatever mood I'm in. Sometimes it's sad, heavy songs, other times it's loud metal, and then my annual Taylor Swift phase (usually after a breakup). It got me thinking: does the climate we live in actually shape the kind of music we gravitate toward? Do people in places like Singapore, where it's always sunny, listen to "happy" songs more consistently than those of us who endure long, grey winters?
My Hypothesis
I started with what seemed like an obvious theory: when exposure to daylight decreases and temperatures drop, we gravitate toward music that reflects our mood. Countries near the equator, where it's always summer climate, should show stable happier musical preferences throughout the year.
I tested this by comparing Spotify top-200 chart data from:
Seasonal countries: US, UK, Sweden, Germany, Canada, France, Netherlands, Norway, Poland, Switzerland, Denmark, Finland
Tropical countries: Singapore, Brazil, Philippines, Thailand, Malaysia, Indonesia, Mexico, Venezuela, Colombia
Using Spotify's "valence" metric, which measures musical happiness on a 0-100% scale.
Seasonal Swings
Musical Happiness by Season
Comparing valence (musical happiness) between seasonal and tropical countries
The data reveals that tropical countries tends to gravitate toward sadder music relative to seasonal countries. Across all seasons besides winter, tropical countries show lower valence scores than their seasonal counterparts. Their range spans from 47.3% (fall) to 52.4% (spring), while seasonal countries range from 48.4% (fall/winter) to 55.2% (spring).
On top of that, both regions show nearly identical seasonal swings. Seasonal countries vary by 6.8 percentage points throughout the year, while tropical countries vary by 5.1 points. It seems that emotional swings transcend climate.
Universal Seasonal Patterns
Monthly Happiness Patterns
Spring peaks and fall/winter valleys show clear seasonal patterns
The monthly breakdown also reveals some further insights. Both regions follow extremely similar seasonal patterns, just at different baseline levels. April is the peak for both, while September (unfortunately my birthday month) has the lowest points.
This suggests that seasonal emotional cycles aren't just about weather, they might be embedded in human psychology or influenced by factors like cultural calendars, economic cycles, or evolutionary patterns that persist regardless of local climate.
The Real Story: Baseline Happiness vs. Seasonal Swings
My interpretation of the data is this: perhaps varying seasons equip us with the ability to withstand harsher conditions, like reduced daylight or colder weather, and still find ways to adapt (hence the higher baseline).
I think it's also important to note that mood and song valence don't necessarily correlate. Someone may have a preference to listen to happy music when they're feeling sad to boost their mood, while someone else may enjoy leaning into their sad emotions by listening to Adele and crying in the shower.
The Verdict
My original hypothesis was wrong, but the truth is more interesting in my opinion. We don't need harsh winters to experience seasonal emotional cycles in our music choices. These patterns seem to be part of a global experience regardless of whether you live in Finland or the Philippines.
Maybe the question isn't whether seasons affect our musical mood, but why different cultures and regions develop different relationships with musical happiness.
The Methodology
Data sources:
- 25,835 matched chart entries from Spotify Charts (2015-2019)
- Chart data with audio feature analysis
- Weekly top 200 charts by country
- 25.8% match rate between chart and audio feature data
Key limitations:
- Chart data reflects popularity, not individual listening habits
- Cultural factors beyond weather influence musical taste
- Sample focused on countries with robust Spotify data
- Regional differences may reflect cultural rather than climatic factors
Audio features explained:
- Valence: Musical positivity (0% = sad, 100% = happy)
- Energy: Perceived intensity and power
- Danceability: Rhythm and beat strength
- Acousticness: Acoustic vs. electronic instrumentation
The analysis code and processed data are available on GitHub for those who want to explore further.
Disclaimer: ChatGPT & Claude was used for a lot of the coding and visual graph creation, but all writing content, data manipulation, & analyses are my own