By Maia Salti
 (Image generated by ChatGPT)
4th Quarter, 00:26, 2nd and Goal
With 26 seconds left on the clock in the fourth quarter of Superbowl 49, the Seattle Seahawks were down 24-28 against the New England Patriots, 1 yard from the end zone. The game was in their hands: one touchdown to become back-to-back Super Bowl champions, having beat the Broncos 43-8 in Superbowl XLVIII the previous year.
With one timeout left, it seemed like an obvious decision. The Seahawks should've given the ball to their star running back, Marshawn Lynch, to cover ONE yard and win the Super Bowl. But no, Seahawks' coach Pete Carroll commanded Russell Wilson to execute a passing play.
The next few seconds were either bliss or torture, depending on what team you were rooting for. My dad, a die-hard Patriots fan for the past 20 years, leaped for joy and screamed at 11 p.m. in our quaint apartment in London, probably waking up our 70-year-old neighbors, as he watched Malcolm Butler, our rookie cornerback, intercept the ball at the goal line to secure the Patriots' Super Bowl win.
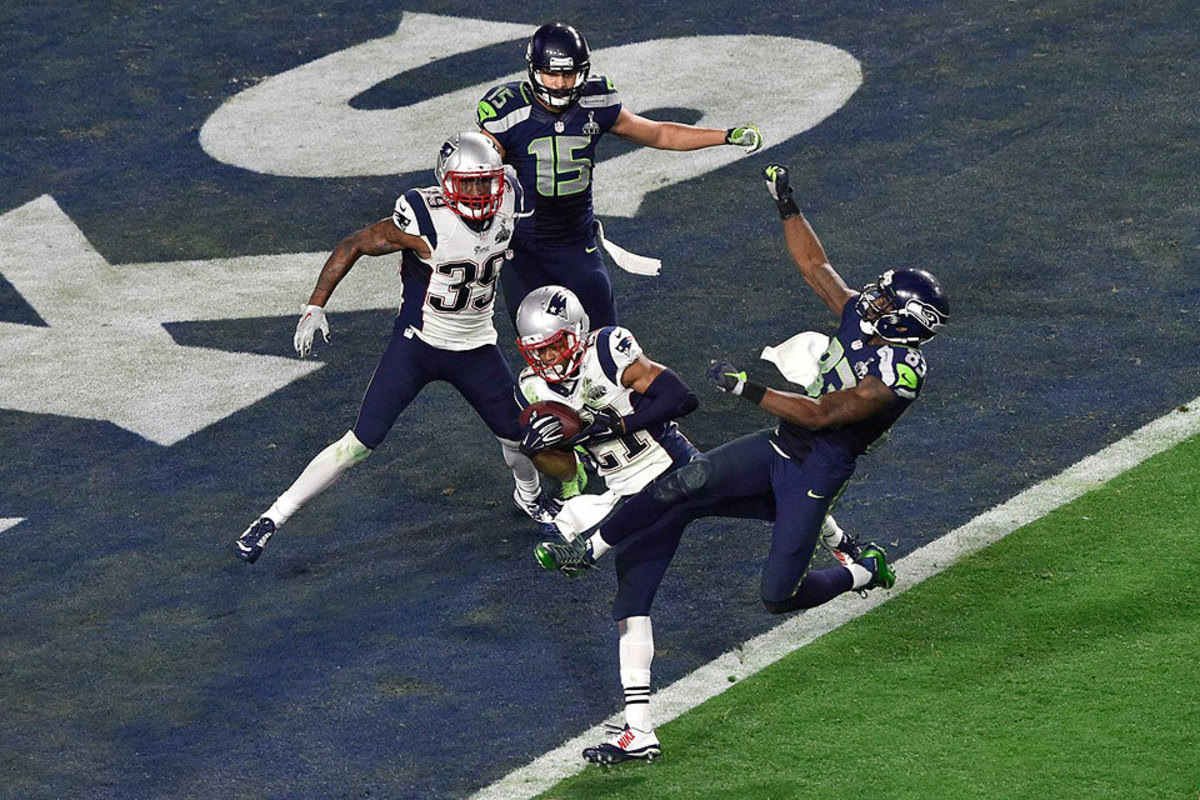 Malcolm Butler, wearing jersey number 21, intercepts the pass at the goal line to secure the Patriots' victory in Super Bowl XLIX.
Following this tragedy, Pete Carroll faced a lot of backlash from fans, claiming that he should've let Marshawn Lynch, one of the best running backs in the league at the time, run the ball. Were the fans right to give him stick, or are they victims of outcome bias?
Game Plan
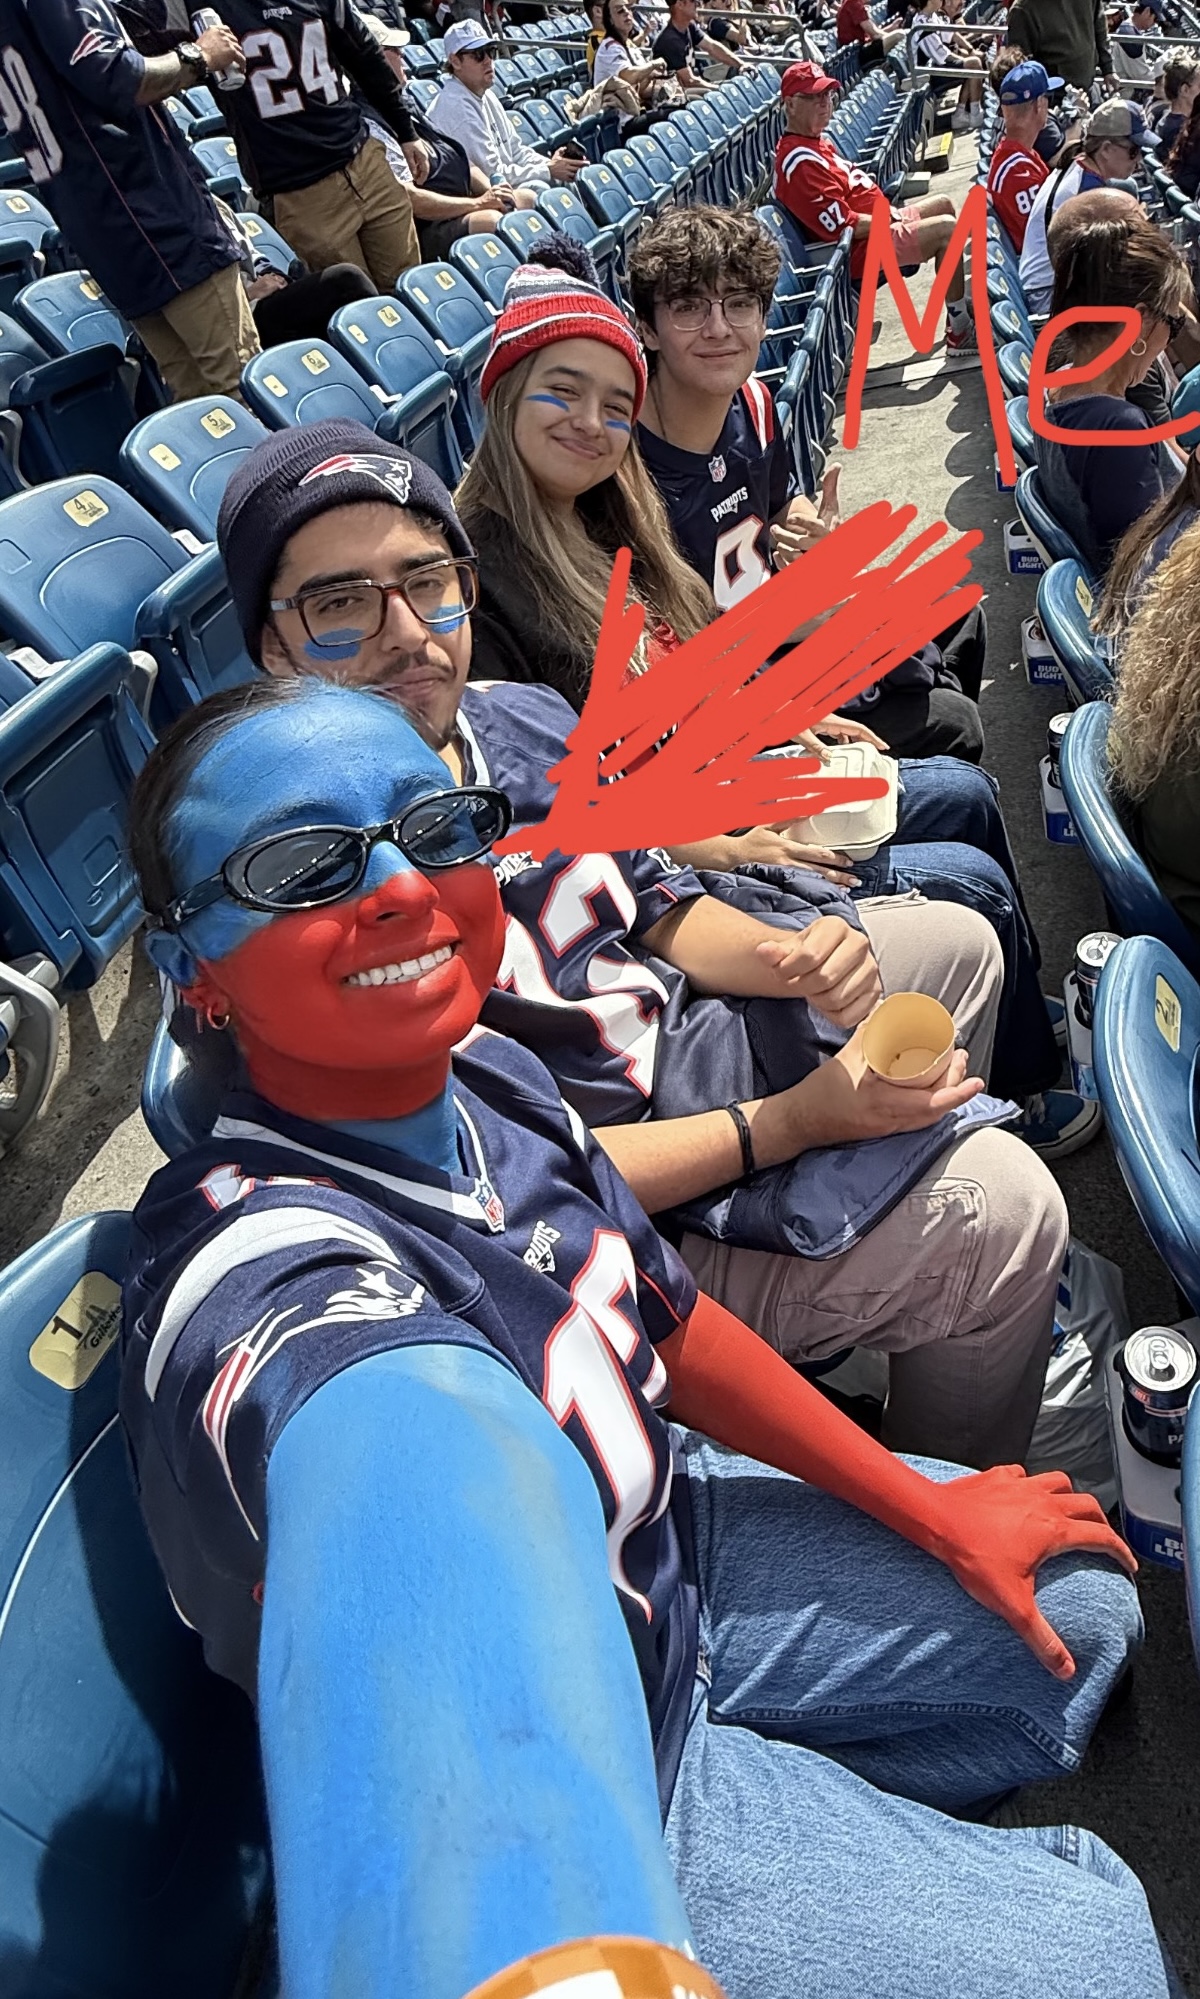
Before I begin my analysis, full disclosure: I need to address my bias upfront. For reference, this is how much of a Patriots fan I am:
Now that we've established that, I vow to keep my analysis unbiased and let the data speak for itself.
I pulled play-by-play data from the nflfastR database, which compiles every NFL game from 2015 through 2024. The dataset includes all regular season and postseason plays, with detailed fields like down, distance, timeouts remaining, play type, and expected points added (EPA). I filtered this data to isolate only goal-to-go plays from the 1-yard line and then compared runs versus passes.
In total, this produced 3,923 plays across ten seasons (2,801 runs, 1,122 passes).
Touchdowns
Touchdown Success Rate: Run vs Pass
Run plays score touchdowns 6.2 percentage points more often (55.7% vs 49.5%)
Interceptions & Fumbles
Interception Risk
out of 1,122 attempts
out of 2,801 attempts
The Malcolm Butler interception was part of a 1.43% risk that only exists when passing.
Running the ball eliminates this risk entirely.
The probability of that pass being intercepted was 1.43%.
If you went to a casino that told you that you had a 49% chance of winning a prize but a 1.43% chance of losing all of your money, would you take that bet? I bet a Super Bowl win that you would.
Fumble Risk
Run plays have a slightly higher fumble rate (1.36% vs 0.54%), but this is still lower than passing's total turnover risk
Total Turnover Risk
Pass plays have a 1.78% total turnover rate vs 1.36% for runs (interceptions + fumbles combined)
Looking at the overall turnover rate statistics, however, we can see that a passing play has a higher turnover rate compared to a running play. Although it may be higher, it is still 1.78%.
Timeout
So yes, looking purely at the statistics, Pete Carroll should have run the ball.
But the timeout situation complicates this analysis. With 26 seconds left and one timeout remaining, the play-calling sequence matters:
If they pass first: An incomplete pass stops the clock automatically, preserving the timeout. This allows them to run on third down, call timeout if needed, then have a final fourth-down attempt.
If they run first: A failed run forces them to burn their timeout immediately to stop the clock. This leaves them with likely a pass attempt on third down (to stop the clock) and a run on the fourth down, a sequence the Patriots' defense could better anticipate.
The real strategic consideration wasn't just about success rates: it was about maintaining unpredictability. Starting with a run would have telegraphed their remaining plays to the Patriots' defense, potentially reducing the effectiveness of those final attempts.
Another point I'd add is that this analysis focuses purely on statistical probabilities and doesn't account for the specific formations and defensive matchups on that play. For a deeper dive into those tactical details, former NFL lineman Geoff Schwartz wrote this article, arguing that the Patriots' unique defensive alignment, a goal-line front with six defenders on the line plus a nickel secondary, actually made running the ball nearly impossible, leaving the Seahawks with little choice but to pass.
Conclusion
So even if passing was the statistically incorrect decision, Pete Carroll should not have received so much backlash.
I think many fans suffered from outcome bias: judging the quality of a decision by its outcome. The real question should be: given all the information that Pete Carroll and offensive coordinator Darrell Bevell had in that moment, was it the decision with the highest probability of success?
But most people saw the interception and blamed it on the only thing they could: that a running play has a 0% chance of interception. What they overlooked is that passing's 1.43% interception risk was nearly identical to running's 1.36% fumble risk. Both plays carried the same catastrophic turnover potential.
The 1.43% just happened to materialize at the worst possible moment. Sometimes, as former NFL lineman Geoff Schwartz's coach would say, "the defense just wins a rep." That's what happened here.
The analysis code and processed data are available on GitHub for those who want to explore further.
Disclaimer: ChatGPT & Claude was used for a lot of the coding and visual graph creation, but all writing content, data manipulation, & analyses are my own